[circle_graph_game]
Worksheet 1: Reading Circle Graphs
Graph Description: A circle graph showing the favorite fruit of students in a class.
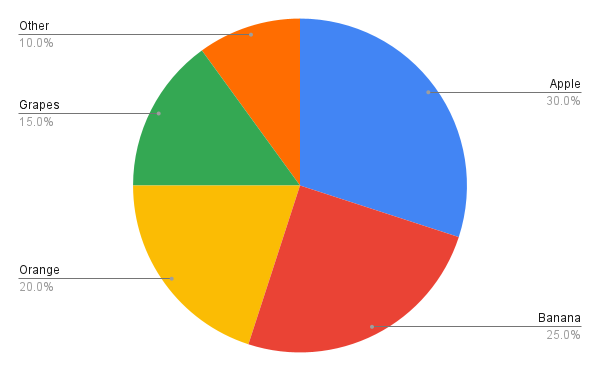
Instructions: Study the circle graph and answer the questions below.
- What percentage of students chose Apple as their favorite fruit?
- Which fruit was the second most popular?
- How many more students preferred Banana over Grapes?
- What fraction of students chose Orange?
- Which category represents the smallest percentage?
Challenge Problems:
- If there are 40 students in the class, how many chose Other?
- What percentage of students chose either Apple or Banana?
- If 10 more students preferred Orange, what would the new percentage for Orange be?
Worksheet 2: Creating Circle Graphs
Data:
| Activity | Time Spent (hours) |
|---|---|
| Homework | 2 |
| Watching TV | 3 |
| Playing | 4 |
| Reading | 1 |
| Sleeping | 8 |
| Other | 6 |
Instructions: Use the data above to create a circle graph. Calculate the percentage of time spent on each activity based on a 24-hour day.
Questions:
- What percentage of the day is spent on Homework?
- Which activity takes up the largest portion of the day?
- How much time is spent on Reading as a fraction of the day?
- What is the total percentage of time spent on Playing and Watching TV?
- How does the time spent on Sleeping compare to the time spent on Other activities?
Challenge Problems:
- If 2 more hours were spent on Playing, what would the new percentage be for Playing?
- Calculate the angle for each activity to be used in the circle graph.
- If the total time spent on Watching TV and Reading was combined, what would the new percentage be?
Worksheet 3: Interpreting Circle Graphs
Graph Description: A circle graph showing the distribution of a family’s monthly expenses.
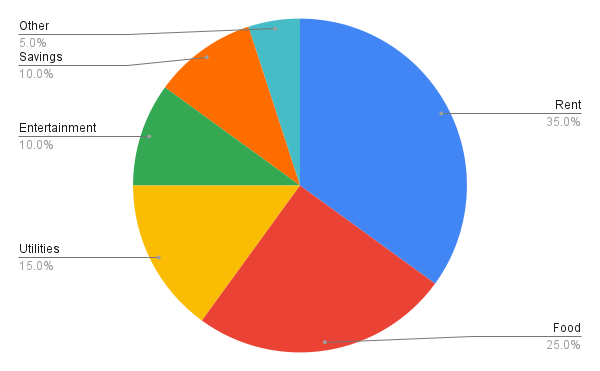
Instructions: Study the circle graph and answer the questions below.
- What percentage of the monthly expenses is spent on Rent?
- Which category represents the smallest expense?
- How much more is spent on Food compared to Utilities?
- What fraction of the expenses is used for Savings?
- Which two categories together make up 45% of the expenses?
Challenge Problems:
- If the total monthly expenses are $2000, how much is spent on Entertainment?
- What is the combined percentage for Rent, Food, and Utilities?
- If the expense for Savings increased by 5%, what would the new percentage for Savings be?
Worksheet 4: Comparing Circle Graphs
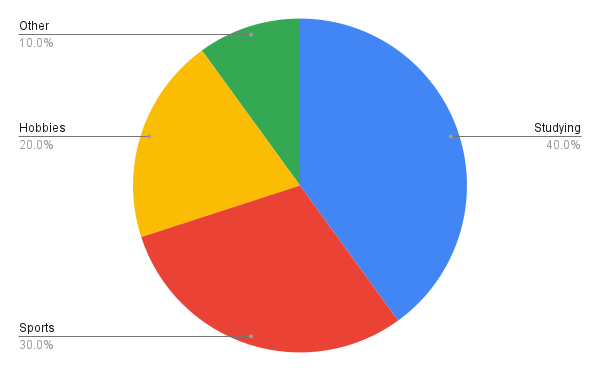
Graph Description: Two circle graphs showing the time spent on different activities by two students, Alex and Jamie, in a week.
Alex’s Activities:
Jamie’s Activities:
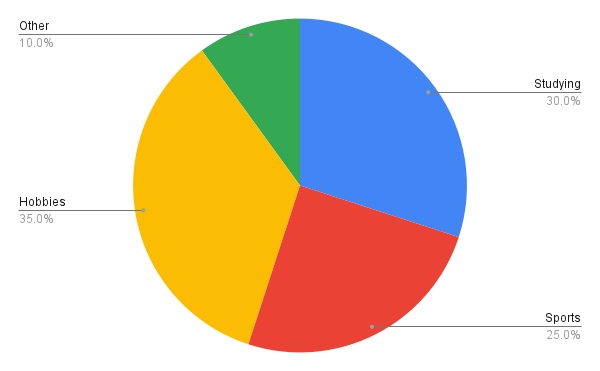
Instructions: Study the two circle graphs and answer the questions below.
- Who spends more time studying, Alex or Jamie?
- How much more time does Alex spend on Sports compared to Jamie?
- Which activity does Jamie spend the most time on?
- What is the percentage difference in time spent on Hobbies between Alex and Jamie?
- Do Alex and Jamie spend the same amount of time on Other activities?
Challenge Problems:
- If each student has 10 hours of free time per week, how many hours does Alex spend on Hobbies?
- Calculate the time spent on Sports by Jamie if she has 15 hours of free time per week.
- If Alex decided to spend 5% more time on Studying, what would his new percentage for Studying be?
Worksheet 5: Analyzing Circle Graphs
Graph Description: A circle graph showing the types of books read by students in a year.
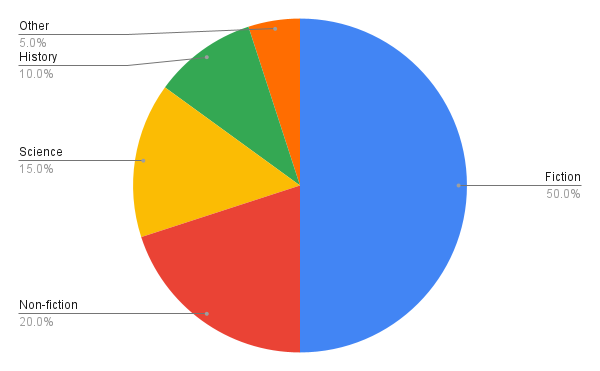
Instructions: Study the circle graph and answer the questions below.
- What percentage of books read are Fiction?
- Which type of book is read the least?
- How much more is the percentage for Fiction compared to History?
- What fraction of books read are Science books?
- If 200 books were read in total, how many were Non-fiction?
Challenge Problems:
- Calculate the number of History books read if 200 books were read in total.
- What is the combined percentage for Fiction and Science books?
- If the percentage for Fiction decreased by 10%, what would the new percentage for Fiction be?
Leave a Reply